FastNetMon - Explained
FastNetMon is a very high performance DDoS detector built on top of multiple packet capture engines: NetFlow, IPFIX, sFlow and SPAN/port mirror. It could detect malicious traffic in your network and immediately block it with BGP blackhole or BGP flow spec rules. It has solid support for all top network vendors and has unlimited scalability due to flexible design.
You could integrate FastNetMon into any existing network without any changes and additional hardware!

Requirements
For Advanced version
The Big difference is that the configuration is saved in MongoDB.
Otherwise
- Influxdb – The Open Source Time Series Database that will store all fastnet db’s
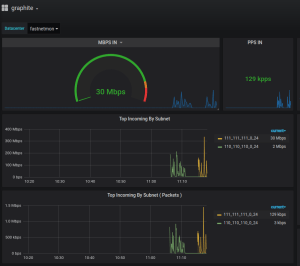
- Grafana as the Open Source Analytics and Monitoring Solution for every database – GUI for fastnet
- Linux distribution (I use Ubuntu 18.04)
Installation
Get in the command line
$ sudo apt-get update
you can install fastnetmon with licence (will be easier later):
NOTE: The licence is my trail version so change it to yours.
$ wget https://install.fastnetmon.com/installer -Oinstaller
$ sudo chmod +x installer
$ sudo ./installer -activation_coupon KIKXAQIQSOZoTboVoWzuYuNyeSeNveGaWyuRiKgaGoZgoMaFkuBoHjoQuSdeLaXcCopy
(If you have any mongo problem with the install just remove all mongo package and try again)
Install docker(for grafana):
$ sudo apt-get update

$ sudo apt-get install \
    apt-transport-https \
    ca-certificates \
    curl \
    gnupg-agent \
    software-properties-common

$ curl -fsSL https://download.docker.com/linux/ubuntu/gpg | sudo apt-key add -
$ sudo apt-key fingerprint 0EBFCD88
$ sudo add-apt-repository \
   "deb [arch=amd64] https://download.docker.com/linux/ubuntu \
   $(lsb_release -cs) \
   stable"

$ sudo apt-get update
$ sudo apt-get install docker-ce docker-ce-cli containerd.io
Edit influx configuration:
$ sudo nano /etc/influxdb/influxdb.conf
Add to [[graphite]] section:
[[graphite]]
  enabled = true
  bind-address = ":2003"
  protocol = "tcp"
  consistency-level = "one"
  name-separator = "."

  # batch-size / batch-timeout requires InfluxDB >= 0.9.3
  batch-size = 5000 # will flush if this many points get buffered
  batch-timeout = "1s" # will flush at least this often even if we haven't hit buffer limit

  templates = [
    "fastnetmon.hosts.* app.measurement.cidr.direction.function.resource",
    "fastnetmon.networks.* app.measurement.cidr.direction.resource",
    "fastnetmon.total.* app.measurement.direction.resource"
  ]
Restart influx:
$ systemctl stop carbon-cache

$ systemctl restart influxdb
Fix some parts of /etc/fastnetmon.conf configuration file:
graphite = on
graphite_host = 127.0.0.1
graphite_port = 2003
graphite_prefix = fastnetmon
Apply changes to configuration file:
$ systemctl restart fastnetmon
Check that the configuration enable
$ sudo fcli
$ show main graphite
$ show main influxdb
If some of them is not enabled then:
$ set main influxdb enable
Get FastNetMon documentation here
Run grafana with docker:
$ docker run -i -v /home/fastnetmon/grafana.ini:/etc/grafana/grafana.ini -d -p 3000:3000 --name grafana grafana/grafanaCopy
Enter the grafana from a browser:
| https://(IP_ADDR | HOST):3000 |
user: admin
password: admin
- Go to
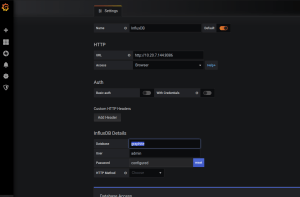
Configuration –> data Sources - Add
data source –> influxdbEnter the host IP for ex: http://10.20.7.144:8086db name: graphite
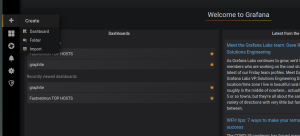
Then add a new dashboad at + –> Import
Enter 7378 (fastnetmon ready dashboard)
Select the influxdb
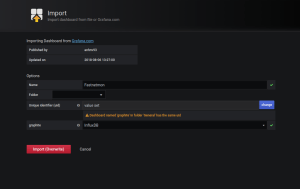
Import, and you are ready to go! ![]()